



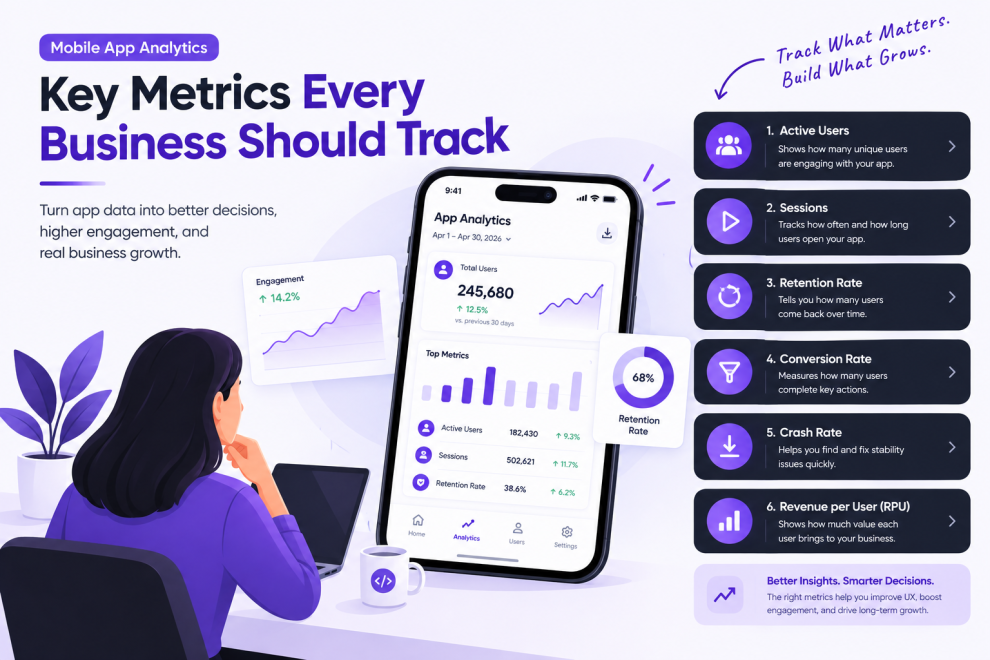

Launching a mobile application is only the beginning of understanding how well it performs.
After release, businesses need to learn whether users discover valuable features, complete important tasks, return to the app, and encounter technical problems. Without reliable measurement, product teams may rely on assumptions instead of evidence when deciding what to improve.
Mobile app analytics helps teams understand user behavior, product performance, and business outcomes by collecting and analyzing relevant data.
The challenge is not to track every possible event. It is to identify the measurements that answer important business questions while respecting user privacy.
What Is Mobile App Analytics?
Mobile app analytics is the process of measuring how people interact with an application and how the application performs.
Depending on the product, analytics may cover acquisition, onboarding, engagement, retention, conversions, crashes, performance, and revenue.
For example, a shopping app may track product views, add-to-cart events, and completed purchases. A fitness app may measure workout completion and weekly activity. A business productivity app may examine feature adoption and task completion.
These measurements help teams identify where the product delivers value and where users experience friction.
Why Mobile App Analytics Matters
Without analytics, teams may know how many people installed an app but have little understanding of what happened afterward.
Users may install the application and never complete onboarding. They may repeatedly encounter a slow screen or abandon a checkout process. A new feature may receive attention without improving the outcome it was designed to support.
Analytics can help answer questions such as:
- Which acquisition channels bring engaged users?
- Where do users abandon onboarding?
- Which features are used regularly?
- How many users return after their first session?
- Which steps cause conversion problems?
- Are crashes concentrated on specific devices?
- Do recent releases improve the experience?
The answers can guide product priorities, engineering work, and marketing decisions.
1. Track Acquisition Metrics
Acquisition metrics help explain how users discover and install an application.
Common measurements include installs, campaign performance, cost per install, and the proportion of users who proceed to meaningful activity.
However, install volume alone can be misleading. A campaign may generate many downloads but attract people who never use the product.
Teams should connect acquisition data with downstream behavior wherever possible.
For example, comparing onboarding completion or early retention across acquisition channels can help identify which sources attract users who are more likely to benefit from the app.
Use attribution carefully and recognize that privacy controls, platform restrictions, and measurement limitations can affect the accuracy of acquisition data.
2. Measure Onboarding Completion
Onboarding introduces users to the product and helps them reach an initial point of value.
Depending on the application, onboarding may include account creation, permission requests, profile setup, preference selection, or a first meaningful action.
Track each important step rather than measuring only whether the entire flow was completed.
For example, a team may discover that many users create an account but leave when asked to connect another service.
This information creates a starting point for investigating whether the step is necessary, sufficiently explained, or technically unreliable.
The objective is not always to shorten onboarding. It is to help users reach the product’s core value without unnecessary obstacles.
3. Monitor Active Users
Daily active users (DAU) and monthly active users (MAU) provide broad views of activity over time.
However, teams need a clear definition of what counts as active.
Opening an app may not represent meaningful engagement for every product. For a project management application, completing or reviewing a task may be more informative than simply launching the app.
Define activity based on relevant product behavior and apply the definition consistently.
The relationship between daily and monthly activity can help teams explore usage frequency, but it should not be treated as a universal measure of product quality. Different applications naturally have different usage patterns.
4. Understand Retention and Churn
Retention measures whether users return after a defined period or event. Churn describes users who stop using a product according to a specified definition.
Retention analysis can reveal whether an application continues to provide value beyond the initial session.
Teams might measure whether users return on the next day, within a week, or after a month. The right interval depends on the product’s expected usage cycle.
A banking application, a daily habit tracker, and a travel booking app should not necessarily be evaluated using identical retention windows.
Segment retention by factors such as acquisition source, onboarding completion, or feature adoption to investigate differences between user groups.
Retention trends are especially useful when evaluated alongside qualitative feedback and changes made to the product.
5. Analyze Feature Adoption
Feature adoption helps teams understand whether users discover and use the capabilities built into an application.
Tracking feature usage can be valuable when a team introduces a new workflow or invests in a major product improvement.
Useful questions include:
- How many eligible users try the feature?
- Do they complete the intended workflow?
- Do they return to it later?
- Does the feature help users achieve their goals?
- Are some user groups struggling to discover it?
Low adoption does not automatically mean a feature is unnecessary. It may be difficult to find, poorly explained, or relevant only to a specific audience.
Before removing a feature or investing in promotion, examine its role in the user journey and test whether discoverability or usability is the real issue.
6. Measure Conversion Funnels
A conversion funnel describes the sequence of actions users take toward a specific outcome.
For an eCommerce app, the sequence might include product discovery, product detail viewing, adding an item to the cart, checkout, and purchase.
For a financial app, it could include starting an application, entering required details, completing verification, and submitting the request.
Measure the proportion of users progressing between steps. This helps identify where the largest drop-offs occur.
A drop-off may indicate confusing UX, unexpected requirements, technical failures, or a mismatch between user expectations and the product.
Use event definitions consistently and avoid assuming that every user should follow exactly the same path.
7. Track Revenue and Business Outcomes
For applications that generate revenue, analytics should connect user behavior to meaningful commercial outcomes.
Depending on the business model, relevant metrics may include purchase conversion, average order value, subscription conversion, recurring revenue, or revenue per active customer.
Subscription products may also examine trial-to-paid conversion, renewals, and cancellations.
Revenue measurements need context. A short-term increase in purchases may not be sustainable if refunds, support costs, or cancellations also increase.
Teams should choose metrics that reflect the application’s actual business model rather than copying a standard list from another industry.
8. Monitor Crashes and Technical Performance
Product analytics is only part of the picture. A mobile application also needs technical monitoring.
Crash rate, app startup time, slow screen rendering, failed network requests, and application-not-responding events can reveal problems that affect the user experience.
Break down relevant issues by application version, operating system, device category, and network conditions when the data is available and collected appropriately.
For example, a crash that appears only after a particular release may point to a regression introduced by a recent code change.
Combining technical diagnostics with behavioral analytics helps teams understand both the scale of a problem and its impact on important user journeys.
9. Measure Notifications and Re-Engagement Carefully
Push notifications, reminders, and in-app messages can bring users back to an application.
However, delivery and open rates do not necessarily indicate that a message was useful.
Measure the actions that follow a notification, such as completing a reminder-related task or returning to an unfinished workflow.
Consider the frequency, timing, relevance, and permission expectations associated with each message.
Excessive or irrelevant notifications can cause users to disable notifications or uninstall the app.
Re-engagement should provide value to users rather than simply maximize the number of sessions.
10. Segment Analytics by User Behavior
Aggregate metrics can hide important differences between user groups.
For example, overall retention might remain stable even though retention among new users has declined. A checkout problem may affect only a particular device category or geographic market.
Useful segmentation dimensions can include:
- New and returning users
- Acquisition channel
- Application version
- Device and operating system
- Subscription or account type
- Feature usage
- Completion of key onboarding steps
Segmentation should have a clear analytical purpose. Creating too many groups can make results difficult to interpret, especially when sample sizes are small.
Avoid collecting sensitive attributes merely because a platform makes them available. Use only the information necessary for legitimate product analysis.
11. Choose the Right Analytics Tools
Analytics tools vary in their capabilities, integrations, data models, pricing, and privacy controls.
A team evaluating solutions should consider:
- Event tracking and funnel analysis
- Cohort and retention reporting
- Crash and performance monitoring
- Integration with existing systems
- Data export and ownership
- Consent and privacy requirements
- Cost at expected usage levels
- Support for the required mobile platforms
Some products specialize in behavioral analytics, while others focus on crash reporting, attribution, or performance monitoring. A business may need more than one tool, but excessive overlap can create inconsistent definitions and unnecessary cost.
Define measurement requirements before choosing a platform.
12. Build a Privacy-First Analytics Strategy
Analytics should be designed with privacy and data minimization in mind.
Teams should identify what information they need, why it is necessary, how long it should be retained, and who can access it.
Avoid sending passwords, payment credentials, private message content, authentication tokens, or other unnecessary sensitive information into analytics events.
Where applicable, provide appropriate consent controls, respect user choices, document data flows, and review the privacy practices of third-party SDKs.
Use access controls and retention policies to limit exposure. Also consider whether analytics data can be aggregated or de-identified for the intended purpose.
Privacy requirements depend on the markets served, the type of information collected, and the applicable legal framework.
13. Turn Analytics Into Product Decisions
Collecting data does not automatically improve an application.
Teams need a process for converting observations into hypotheses, experiments, and measurable improvements.
A practical cycle is:
Observe: Identify an unexpected pattern or recurring problem.
Investigate: Combine quantitative data with user feedback, session observations, and technical diagnostics where appropriate.
Hypothesize: Explain what might be causing the problem.
Test: Introduce a focused change or experiment.
Evaluate: Compare the results against a defined baseline and success metric.
For example, if users frequently abandon a registration flow, the team might test clearer instructions or remove an unnecessary field. The change should then be evaluated using completion rate alongside error rate and downstream quality.
This approach helps teams avoid making product decisions based on isolated metrics.
Common Mobile App Analytics Mistakes
Several mistakes can reduce the value of analytics.
Tracking too many events. An oversized event taxonomy becomes difficult to maintain and interpret.
Using unclear definitions. Different teams may calculate active users, conversions, or retention differently.
Optimizing vanity metrics. More installs or sessions do not necessarily mean better user outcomes.
Ignoring technical performance. Behavioral metrics may conceal crashes, slow screens, or failed requests.
Collecting unnecessary personal data. Excessive data collection creates privacy risk without guaranteeing useful insights.
Failing to act on findings. Analytics provides value when it influences product decisions and subsequent improvements.
A Practical Mobile App Analytics Roadmap
A useful implementation process can be organized into six steps.
Step 1 — Define goals: Identify the business and user outcomes the app should support.
Step 2 — Select key metrics: Choose a small set of measurements connected to those goals.
Step 3 — Create an event plan: Document event names, properties, triggers, and intended use.
Step 4 — Implement and validate: Confirm that events are accurate, consistent, and free of unnecessary sensitive information.
Step 5 — Build reporting: Create dashboards for product, engineering, and business stakeholders based on their decisions.
Step 6 — Review and improve: Evaluate trends regularly, investigate changes, and test improvements.
Teams developing or modernizing mobile products, including companies such as GeekyAnts, can benefit from integrating analytics planning into product design and engineering rather than treating measurement as an afterthought.
Final Thoughts
Mobile app analytics helps businesses move from assumptions to evidence.
By tracking acquisition, onboarding, retention, feature adoption, conversion, revenue, and technical performance, teams can understand how well their applications serve users.
The key is to select meaningful metrics, collect data responsibly, and connect findings to real product decisions.
Successful analytics is not about measuring everything. It is about measuring what matters, understanding why it matters, and using the results to build a better application.




Add Comment